Centralised Business Intelligence System
Empowers SaaS to be Driven by Smarter Insights
BACKGROUND
The client (Eventopedia) is an intelligent lead generation platform for global hotels and venues. Its mission is to increase enquiry conversion and event planner productivity. The powerful search and matching platform makes event planning easier for all event planners, allowing more time to create more impactful events. Eventopedia also helps event venues, hotels and suppliers to promote their brands online, ensuring that all suppliers communicate their story cost effectively for greater ROI.

Industry: Hospitality & Events
Business Type: Software, Online Marketplace
Website: https://www.eventopedia.com
THE CHALLENGES
Increase revenues and provide more added value
Venue owners and event suppliers are Eventopedia’s clients who use a freemium model when joining the platform: venue owners and event suppliers can list their places/services for free but could upgrade to paid plans to get additional services. One of the goals for Eventopedia is to onboard more clients to join the platform and upgrade more clients to the paid plans. Therefore, Eventopedia need to provide more added value for their clients, for example, demonstrating how many event planners discover the venue owners/event suppliers through Eventopedia’s platform, how many leads venue owners/event suppliers got from Eventopedia’s platform, etc. This data is contained within the application search logs, which uses Microsoft Azure Search, Google Analytics Tag Manager and the application internal database.
Need more insights into user activities to prioritise development
One of the goals of Eventopedia is to improve user experiences and reduce user churn, which involves changing/adding features and monitoring users’ behaviours to assess the performance of the changes. Knowing what their users are doing could help them understand the users better, prioritise the development of different useful features and decide which improvement is the best to continue or which one needs to go through further changes. However, it is not easy to extract the user activity data: some users’ actions on the websites are tracked by Google Analytics Tag; the search data is tracked in the Azure Search Logs and some users’ behaviour data are in the application internal database, which has unformatted data that could only be accessed by the client’s internal IT team.
Need to optimize marketing and sales spending to drive the best results
One of the goals for Eventopedia is to gain more growth, therefore, they will increase their efforts in marketing and sales in order to get more users and clients. Their growth strategy includes email marketing, content marketing, Google Ad words, Facebook ads, Linkedin ads etc. Because of the diverse marketing and sales channels, and without any marketing attribution model and process set up, it is not easy for the client to identify the best performing channels, thus difficult for them to optimize spending to drive the best results.
Reporting is difficult and time-consuming
Eventopedia data is scattered in many different places: Google Analytics, Google Tags, MS Azure, Application Internal database, etc, therefore, without a centralised business intelligence system in place, whenever the client needed to do reporting, or discuss whether to make a certain business decision, or to have a better understanding of the application performance, the client needed to spend a significant amount of time crunching through excel files, piling up charts and trying to decipher data without a clear picture.
THE PROCESS
Business Assessment and Data-Driven Roadmap
We first conducted the initial consultation (free of charge) with Eventopedia in cooperation with Chatbot Ltd. We analysed the business, drew user flow of the application to identify each touch point that can capture useful information. Based on the findings, we identified actionable metrics and KPIs that could be used to help them understand their users better and more effectively assess their performance.
We designed a roadmap for Eventopedia to become a fully data-driven business with a holistic and strategic view. According to the plan, we split the project into several phases with different sprints and recommended the client to start with measuring the user behaviour, which means that we first integrated the following data sources: the application database, MS Azure search engine logs, and Google Analytics and Tags.
Technical Assessment of Infrastructure and Data Sources
Based on the data-driven roadmap, we prepared the entire infrastructure plan and gave the client a comparison of databases/data lakes/data warehouses, a comparison of production stacks, and corresponding pricing plans and capacities. We also helped the client to select the most optimal combination for configuration of the centralised business intelligence system.
After the project was defined with timeline and deliverables, we then reviewed the existing data sources in order to define available and missing data sources. Since the client did not have any data extraction solution in place required to calculate the KPIs, our data engineers gave the client and their IT team specific instructions on additional instrumentations required to capture necessary data points during interaction with users.
OUR SOLUTION
During the Phase I implementation, we conducted data engineering, data analytics, and business intelligence activities with a particular focus on centralising separate data sources, extracting insights into user behaviour, user retention, user growth and marketplace efficiency.
Created extract, transform and load (ETL) process to Integrate separate data sources into a centralised BI database
We integrated different separate data sources into a centralised business intelligence database, specifically the data sources that contain data necessary for extraction of KPIs related to user behaviour, and the performance and utilization of the marketplace, and other activities of the platform.
We used Python and pETL library to develop a periodic and automated process to efficiently extract data sources needed to calculate the KPI, apply transformations including filtering, cleaning and format changes to the data, thus making it analytics-ready, and finally to load the data into the BI database ready for exploration.
Data analytics and insights calculation
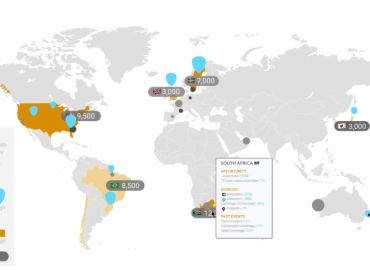
Once the data was pre-processed, cleaned, filtered and stored in a centralised BI database, we applied exploratory analytics and extracted the initial set of insights from the data. In order to shed light on user behaviour, we prepared several groups of insights and KPIs, and below are some examples:
- Growth: signup rate per user type, account growth rate per account type, listing growth per plan and per category;
- User Behaviour: account distribution, contact venue/supplier count, venue assigned listing percentage, reveal venue/supplier phone number count;
- Use Retention: churn rate per plan, active user per account type and per plan;
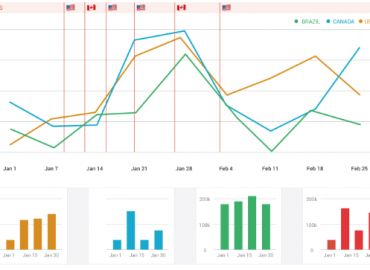
- Marketplace Efficiency: blank search rate, keyword search trend, filter search trend (per location, type, category etc), click-through rate;
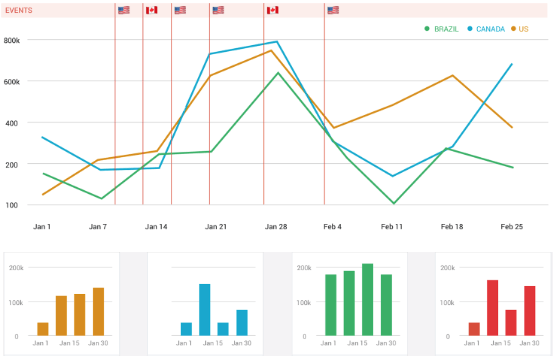
Set up easy-to-use BI tool with rich dashboards and reports
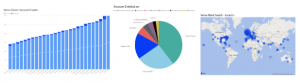
In order to visualise data, we created dashboards and reports in Microsoft Power BI, which is easy to use interactive BI tool. The client is now able to easily view and export reports for board meetings, or drill down into the data revealing patterns on-the-fly to help them with decision making.
BENEFITS
Saving Time – Easy KPI tracking and reporting
With the KPIs being tracked, Eventopedia can easily show the dashboards to investors, boards and other stakeholders about hitting the required milestones, which is important in securing funding. Instead of having to spend a significant amount of time compiling numbers gathered from different sources, crunching excel files and charts, now the data can easily be viewed and shown in seconds.
Improving Performance – Smarter insights for decision making
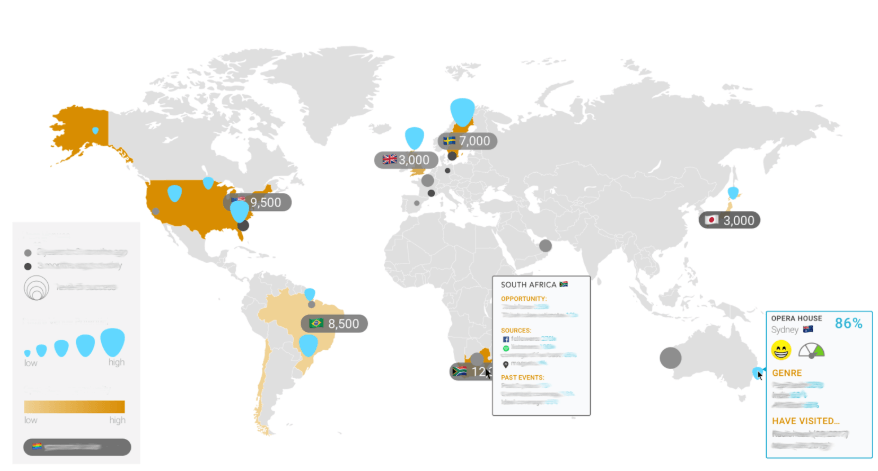
With relevant metrics being measured and easily assessed, Eventopedia can now have clearer insights to devise actionable strategic plans. For example, by knowing the unmet demand from event planners (which type of venues in which city the event planner are searching that they do not yet have in their platform), they can have a stronger focus and bigger leverages to onboard more venues.
Increasing Potential – Gathered useful data that otherwise would be lost
With the extraction and storing process being implemented, some data that would otherwise be lost is now being stored and accumulated in the centralised BI database (e.g MS Azure search log only store data for 90 days, Google Analytics for 180 days, etc). With the accumulation of these additional data, they can gain more insights that are relevant to their and stakeholders, which can help them develop, refine their business model and inspire other future potentials.
TECHNOLOGIES USED


About the Project
We help Eventopedia build a centralised business intelligence system that empowers them to be driven by smarter insights through setting up extract, transform and load (ETL) process to integrate separate data sources into a centralised BI database and easy-to-use BI tool with rich dashboards and reports.
Client
EventopediaRelated Projects
Sed arcu. Cras consequat.


